
As more members adopt distributed energy resources like residential batteries and EVs, co-ops are facing an unfamiliar challenge: Some members may not inform their co-op about new residential installations. Without that visibility, it's much more difficult to plan for a neighborhood's energy needs.
Whether the lack of disclosure is accidental or not, the result is the same: a less efficient model for load estimation, which comes with the potential for overloads or service disruptions.
So how do you figure out who's installed a battery or bought an EV? You can get a long way by finding permits, comparing time-of-day usage, locating specific kW spikes, and watching for neighborhood adoption waves. Then, you can supplement your sleuthing by performing a difference-in-difference analysis on your data.
Four signals to check today
Before we dive into specialized strategies for hard-to-find DERs and noisy data, here are four straightforward markers of new DERs:
-
Installation permits: Members often file for installation permits with the city or county for residential batteries or Level 2 EV chargers. Keep an eye on local permit filings that reference batteries or chargers, in case a member doesn't know (or forgets) to inform the co-op of the installation.
-
Usage timing shifts: If you have time-of-day usage data for individual members, watch for significant shifts in a member's time of energy use, as this could point to a new residential battery. This phenomenon is particularly common for co-ops with time-of-use pricing. Members often use batteries to shift load to a less expensive time of day.
-
Load spikes: Level 2 chargers commonly draw between 7 and 19 kW. If you see spikes in usage between those specific numbers, particularly if the load shape matches a typical EV charging schedule, that may be a sign that an EV is present.
-
Patterns in a geographic area: EV adoption often comes in waves, with multiple members in a neighborhood adopting EVs around the same time. If two or three members in a neighborhood notify you of their new EVs or accept an EV incentive, there might be more EVs to discover in that area.
These techniques should help you get a better ballpark number for new DERs. But if you want to unearth more of the 'hidden' batteries and EVs out there, you'll need a more advanced technique.
A quick primer on difference-in-differences
If difference-in-differences analysis isn't a common part of your toolkit already, it could be a powerful concept to explore. This type of metric analysis compares a treatment group with a control group to identify the magnitude of an effect caused by an outside source.
For example, a city planner might want to know to what extent a new grocery store is impacting parking in a residential area. A difference-in-difference analysis for this question would use four data points: the parking situation before and after the grocery store, in the grocery store's area and in a different area in the same neighborhood.
The difference between the expected parking availability for the grocery store area (given the nearby area) and the actual parking availability for the grocery store area approximates the impact of the new grocery store on the parking situation.
As with all economic modeling tools, there's a lot more nuance to explore here. But even at its most basic, difference-in-differences is a powerful tool for discovering specific features in inherently noisy data like grid load.
Building your model to find hidden DERs
Use the ideas below to develop a basic difference-in-differences model for locating batteries and EVs that aren't clearly present in the "easy wins" methods. After that, we recommend using iterative experimentation to refine your model over time.
-
Choose a neighborhood where you want to test for new DER presence. Select a geographic area that will form your "treatment" neighborhood — the neighborhood where you suspect there may be new DERs present. Potential ideas are a neighborhood with a stressed transformer, or one where the overall load was unexpected last month. To minimize the number of variables, try not to cross community or transformer-coverage boundaries. We also recommend choosing one type of DER at a time, as the aggregated grid effect of batteries is usually different from that of EVs.
-
Choose a control area that closely resembles your treatment neighborhood. You want to limit the difference in environmental effects between the two areas you use for the analysis. The size, general location, and demographics of your control area (the area where you don't think there are new DERs) should match your test neighborhood as closely as possible. Look for areas that have had similar historical demand graphs.
-
Set a lookback period that captures your hypothesis for neighborhood DER introduction, but not The lookback period is the time span between your first and second data points. If your lookback period is too long, you may measure the effects of more than one event (EV adoption and the neighborhood changing demographics, for instance). If the period is too short, you might minimize the effects of the event. Try to choose an in-between time span, usually about one to three months for neighborhood-level data.
-
Modify the lookback and geographic granularity to detect shifts in individual behavior. At first, you'll likely want to look at daily or monthly energy usage, to detect which neighborhoods have changed their behavior. After you confirm or deny your suspicions about a specific neighborhood, you can then increase the granularity of your lookback period and geographic area to compare one house to another. Hourly data is particularly useful for these granular comparisons.
An authoritative strategy will likely require iteration. This is easier with an econometrics tool like Stata or RStudio, where it's simple to adjust individual components. However, it's perfectly feasible to develop a difference-in-differences model in Excel or even (for the brave of heart) by hand.
Let your AMI data do the detective work
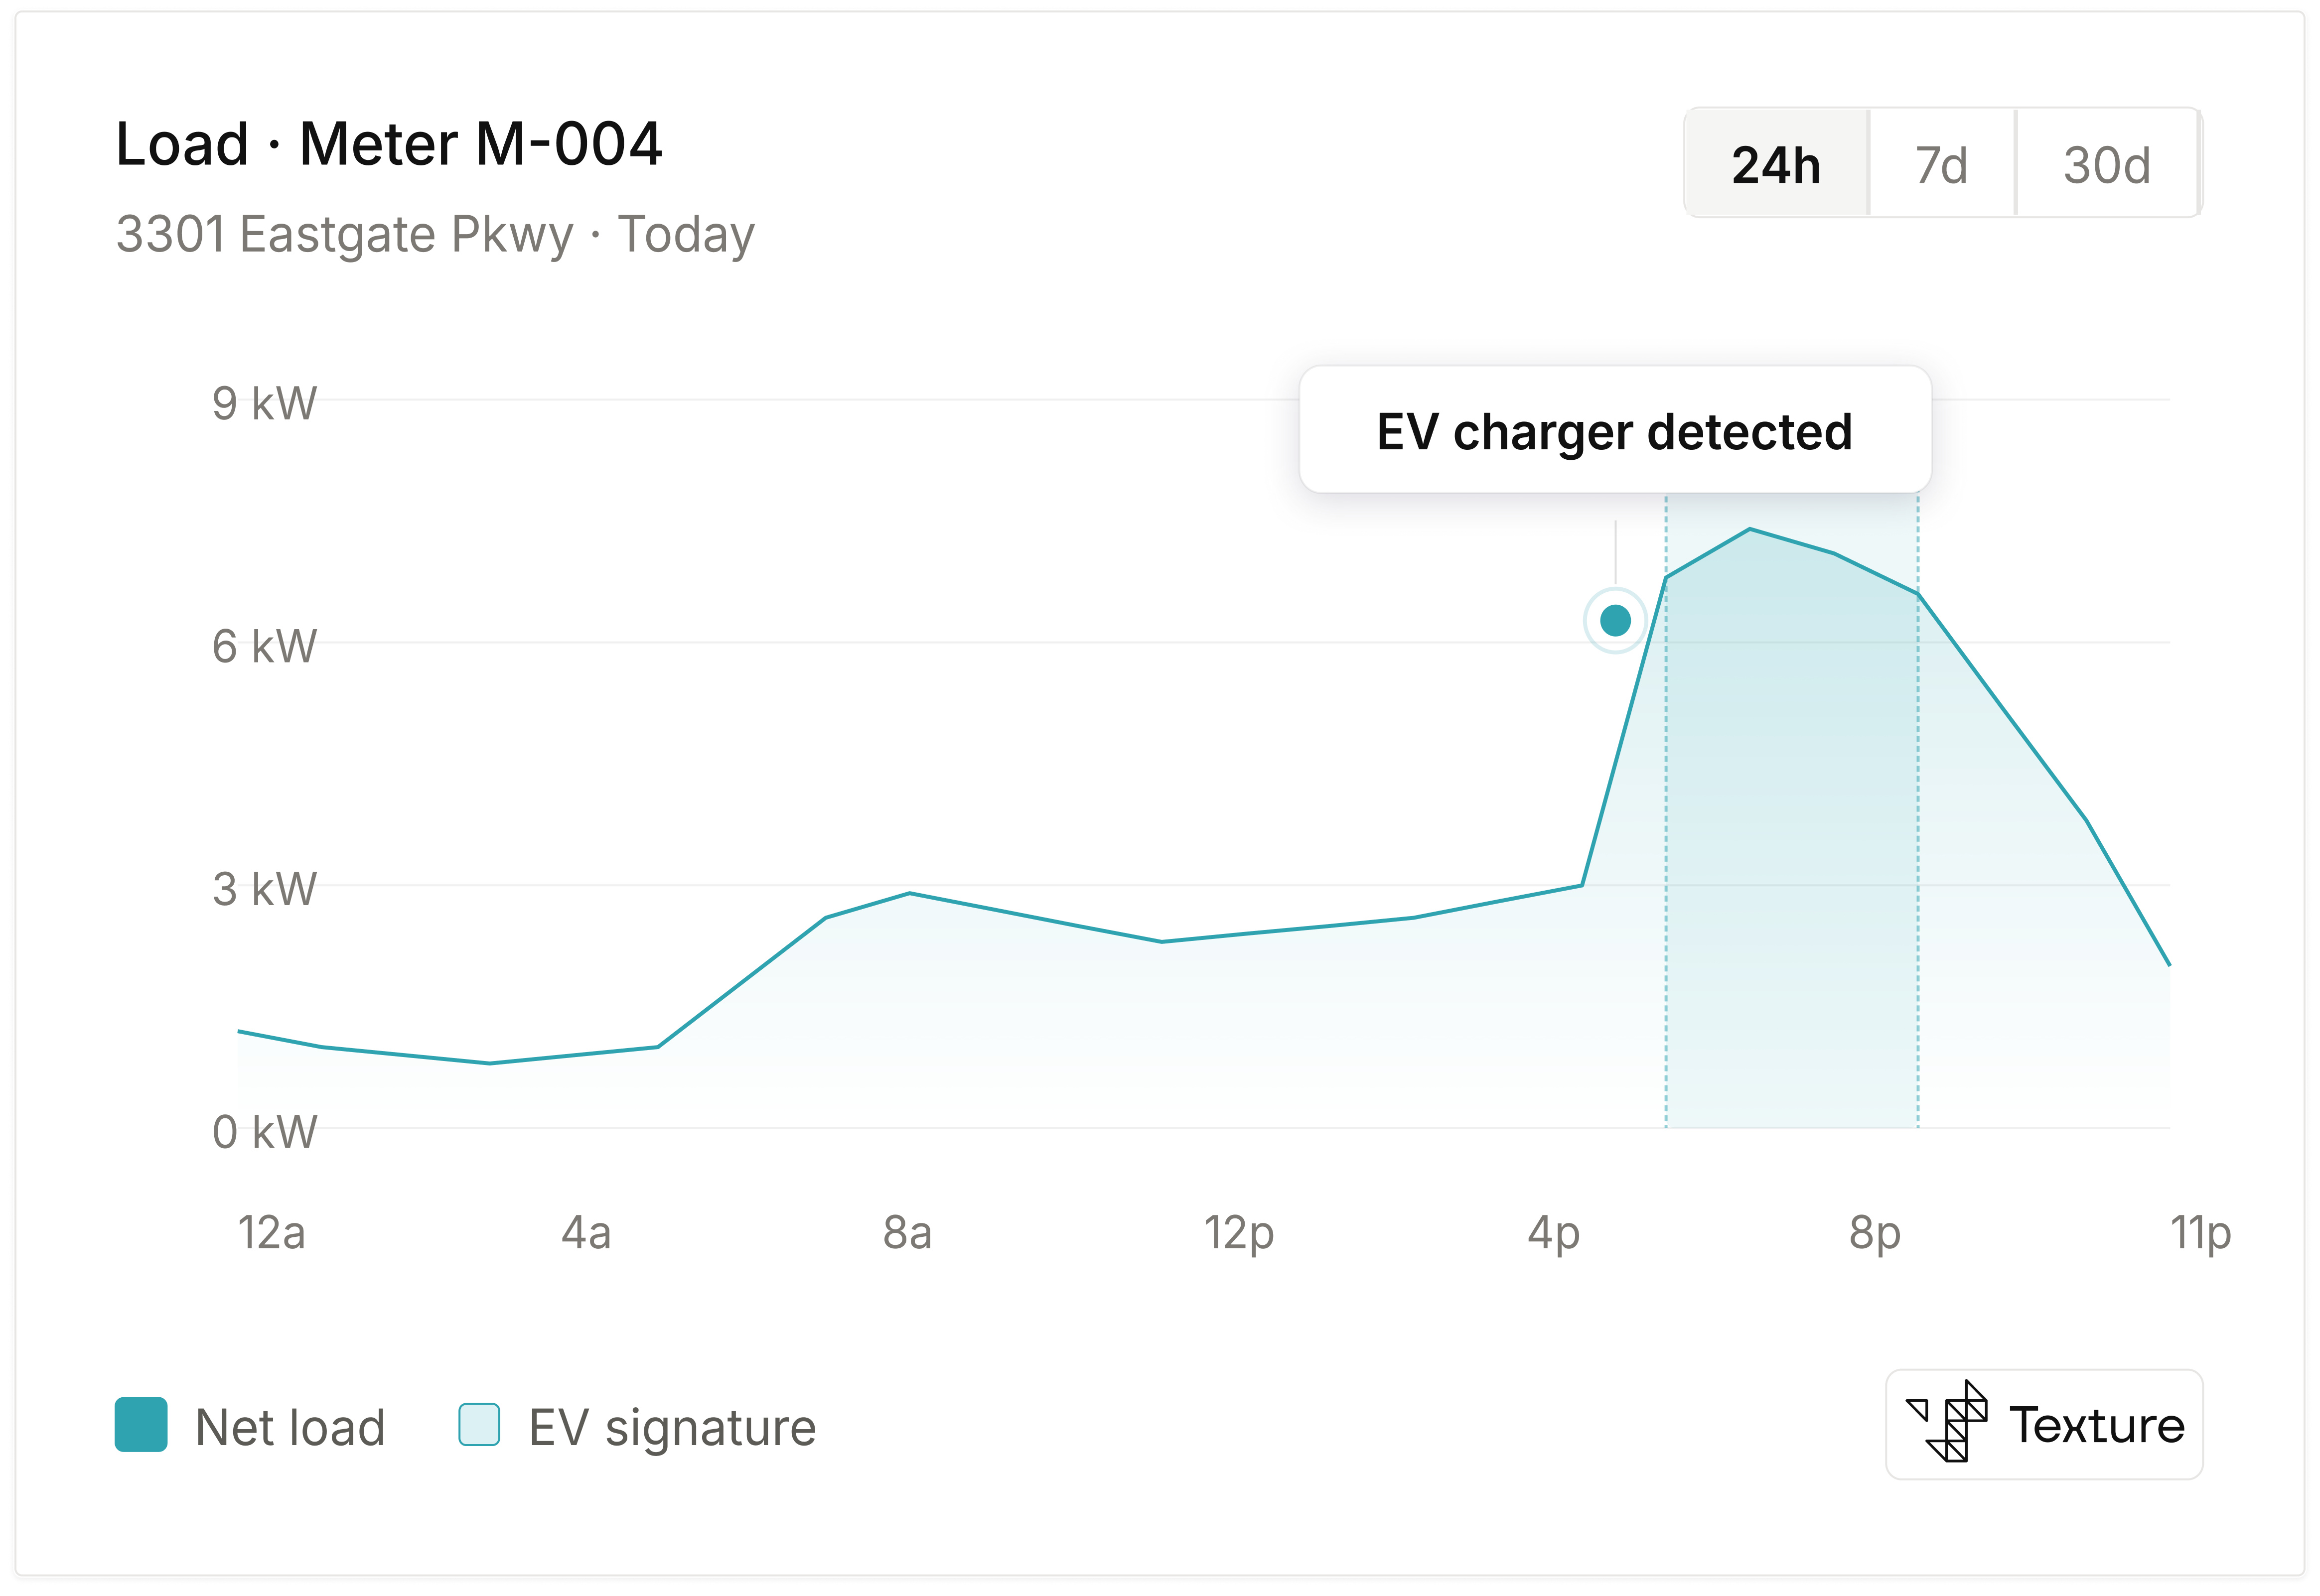
You can also detect a significant number of EVs and batteries by looking at your AMI data. We’ve helped a number of utility co-ops detect EVs with Texture. A utility can securely share AMI interval data from as few as 100 meters with us, going back a few months, and Texture analyzes those interval reads for distinctive EV charging signatures.
Sustained, high-power evening load patterns typical of Level 2 chargers, for instance. Because the analysis runs on data the utility already collects, teams can identify likely EV adoption without relying on customer self-reporting, interconnection records, or surveys. The result is a practical list and map of detected EVs that can be used for transformer loading analysis, member outreach, managed charging enrollment, and program planning.
Put your findings to work
Successfully identifying new DERs opens up a world of possibilities. Perhaps you'll set up a demand response program, or spread awareness about EV charging considerations. In either case, you might want to hear from other co-op leaders who are working on similar initiatives.
If you're interested in building community with peers outside of the occasional conference, we invite you to join Texture's Cooperative Operations Research and Development (CORD) group. The group meets online to discuss the opportunities and challenges that affect co-ops today. We'd love to hear your perspective.