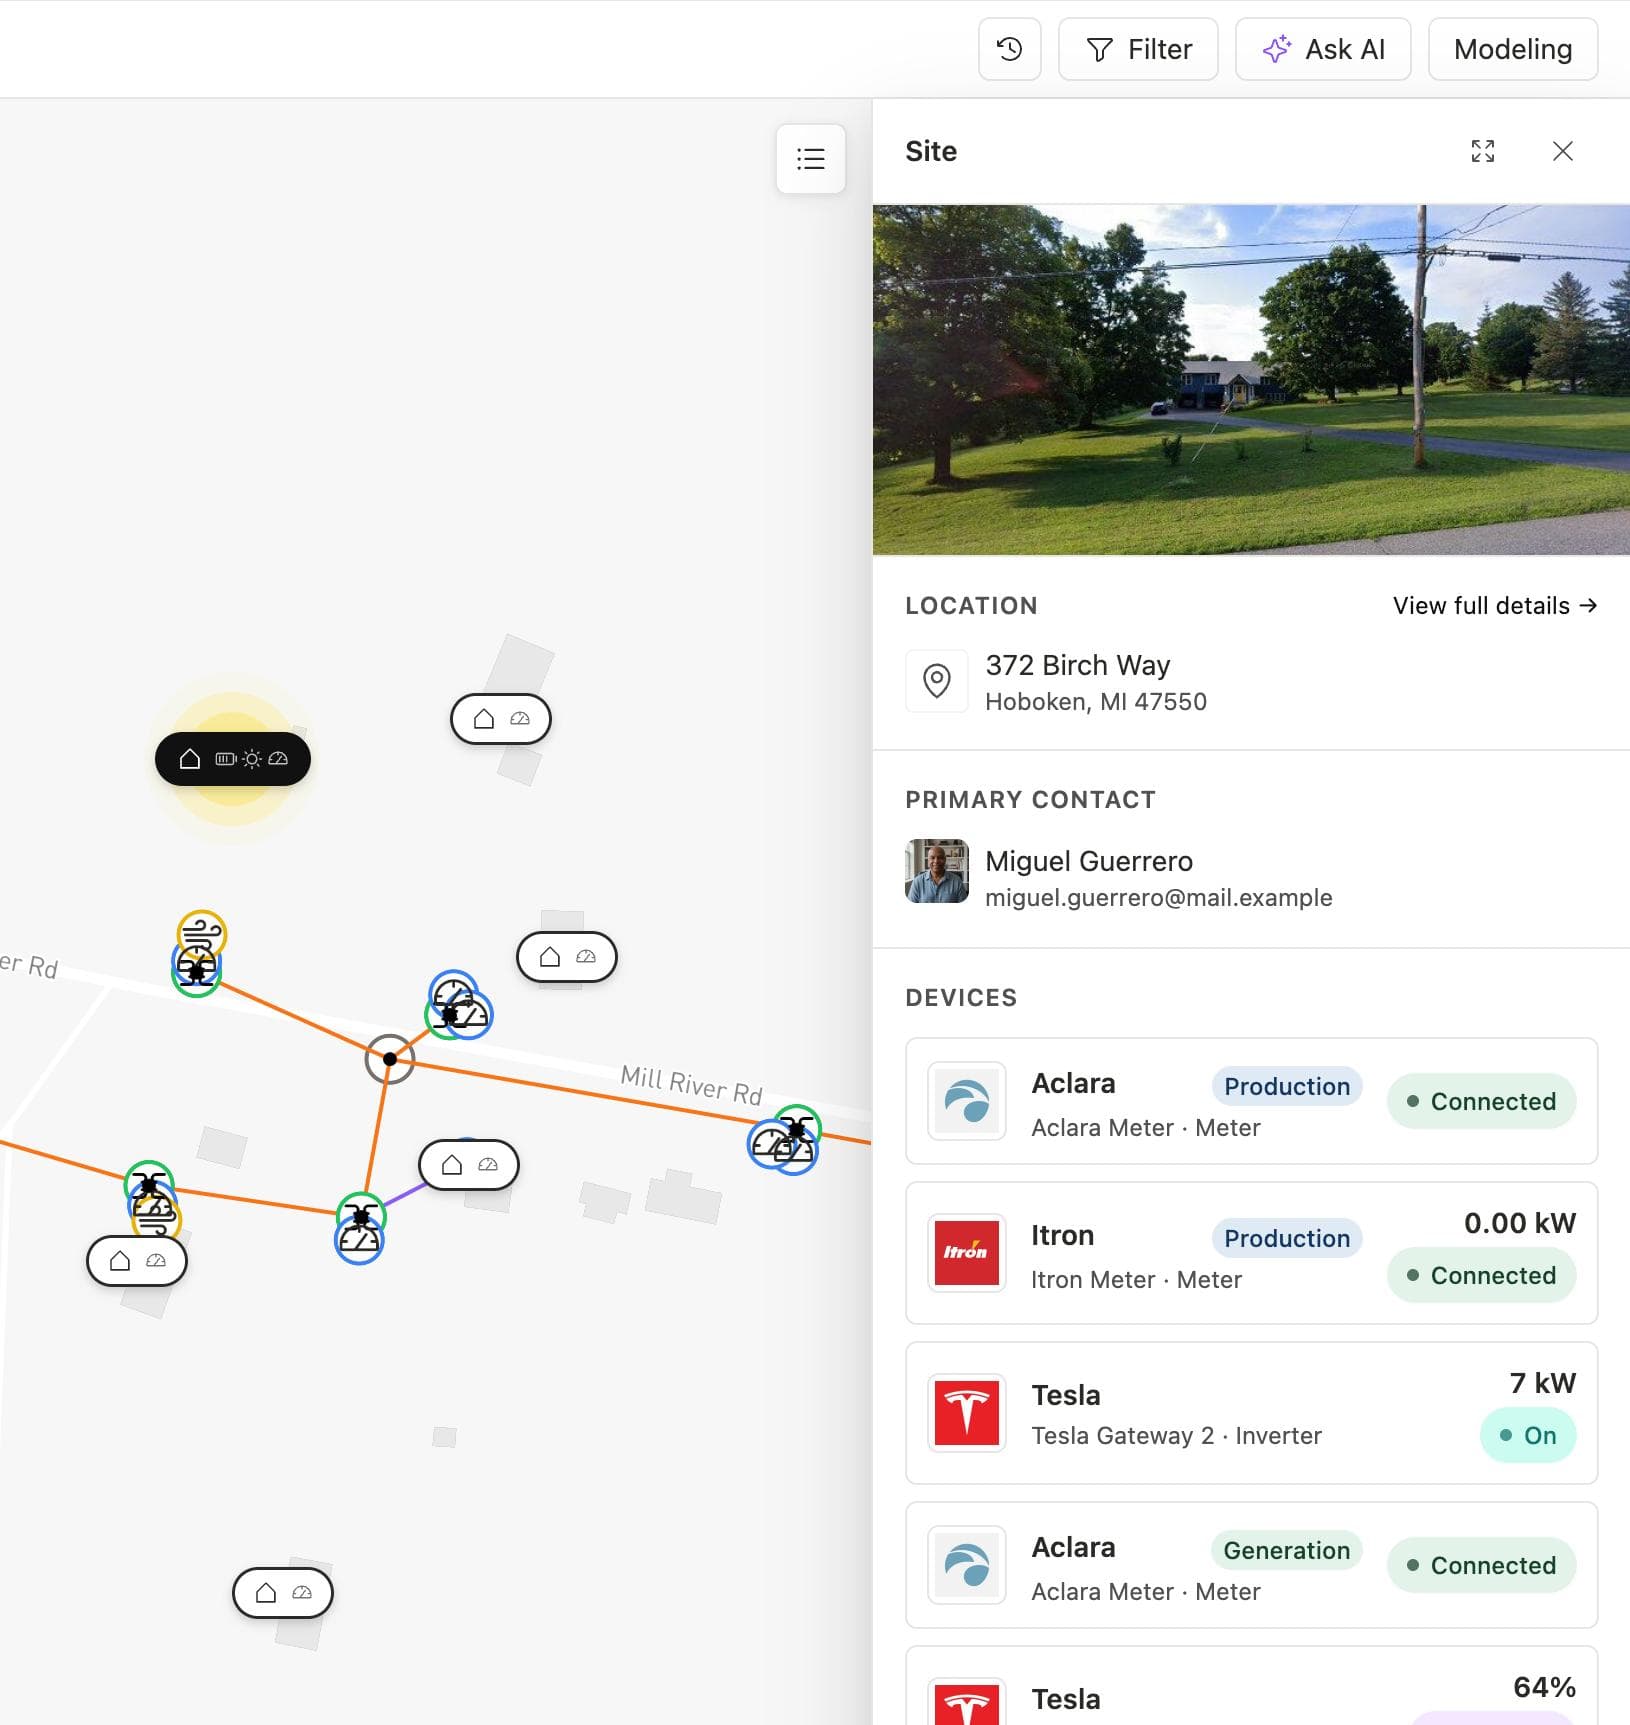
44,293 sites. 50,424 devices. 252,746 grid elements. One connected model.
372 Birch Way, Hoboken. Two meters. A Tesla battery charging at 64%. An inverter pushing 7 kW. The transformer upstream. The feeder above it. One view. No switching systems.
Grid operators see topology but not customers. Billing systems see customers but not devices. Device platforms see DERs but not the grid they are connected to. Asset systems get halfway across the map and stop.
Every utility runs all of these. None of them talk to each other. That means the simplest question, "which transformer are those batteries behind?", takes three systems and a spreadsheet.

Texture is the only one that holds all six in a single model. Grid, meters, sites, devices, customers, programs. All connected.
But covering the columns is just the start. Inside each one, the real world is messier than any system was built for.
A single address straddling two transformers. A battery behind its own meter with no dwelling. Solar generation and consumption at the same service point. Two customers responsible for one address, the resident and the owner, with different programs and different bills.

Most platforms handle the clean cases. The standard meter-to-home chain. Everything else becomes a ticket, a note in a spreadsheet, a special case that breaks the model.
Texture models all of it explicitly. Every messy configuration is a first-class citizen. None of them has to be special-cased later, because they are not special. They are normal.
Which means the platform can answer questions no other system can. Which batteries are behind an overloaded transformer? Where on the grid is this DR program actually reducing load? Which feeders have more solar than the transformer was built to handle?
Most software cannot answer these. Not because the analytics are not there. Because the connections are not.
Most software gives you a list of meters and a list of devices. Texture connects them. And when the model is connected, the platform can do things that batch reports and static dashboards cannot. But that is next week.
