
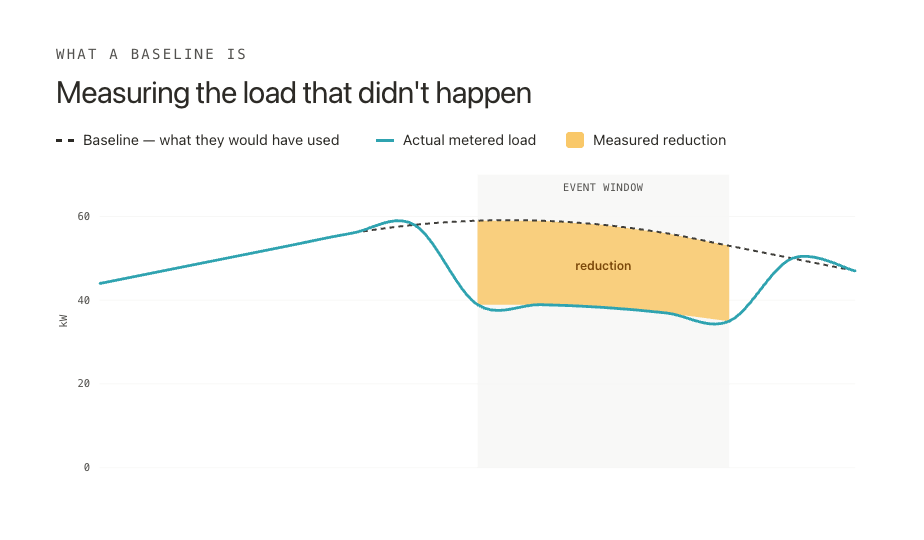
After a demand response event, the first question is always the same. How much load actually dropped? That's easy when you can see telemetry directly from a battery or an EV charger. But for programs like thermostats or water heaters that only provide temperature reduction or for a behavioral beat the peak program that requires meter data to infer what happened.
A load baseline is the estimate that fills that gap. Subtract the actual metered load from the baseline, and the difference is the reduction the program provides. Get the baseline wrong and every payment and every capacity report built on it is wrong too.
The common method: high X of Y
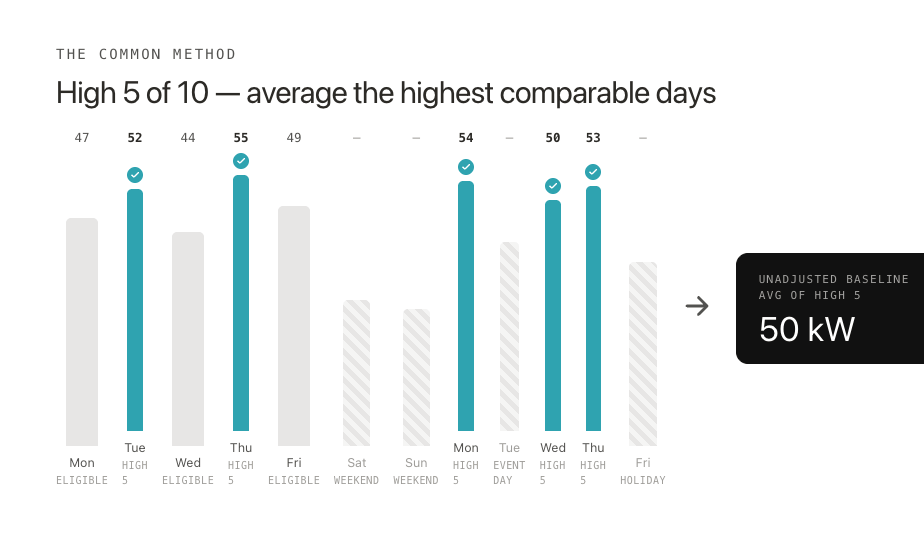
The most common approach is an average of similar recent days, usually written as high X of Y. This methodology takes the most recent eligible weekdays and drops the ones that are not fair comparisons. Weekends, holidays, and earlier event days are taken out, because those are not normal days. From what is left, average the highest-use days hour by hour.
High 5 of 10 is typical: the five highest-load days out of the last ten eligible weekdays, averaged across the event window. Choosing the highest days tilts the number slightly in the member's favor, which keeps programs worth joining. Some programs use the middle days to stay neutral. No one strategy is more correct, but a program needs to be run consistently so the resulting incentives match what actually happened.
What the ISOs actually use
The wholesale markets have specific rules for baselining. PJM defines its economic demand response baseline in Manual 11, Energy and Ancillary Services Market Operations, in the demand resource settlement section: a high X of Y average with a day-of adjustment. PJM uses a separate method for capacity, the Peak Load Contribution, based on demand during the prior summer's peak hours.
ISO-NE keeps its rules in the M-MVDR manual, linked from its demand resources page, built on historical interval data averaged over similar days with a day-of adjustment. The settings differ by market. High 5 of 10 with a 20 percent cap is one configuration but not a universal standard.
The day-of adjustment
An average of recent days has one weakness. The event day might be hotter than any of them, and most load that moves on an event day moves because of temperature. A baseline built from milder days sits too low, and the member gets underpaid.
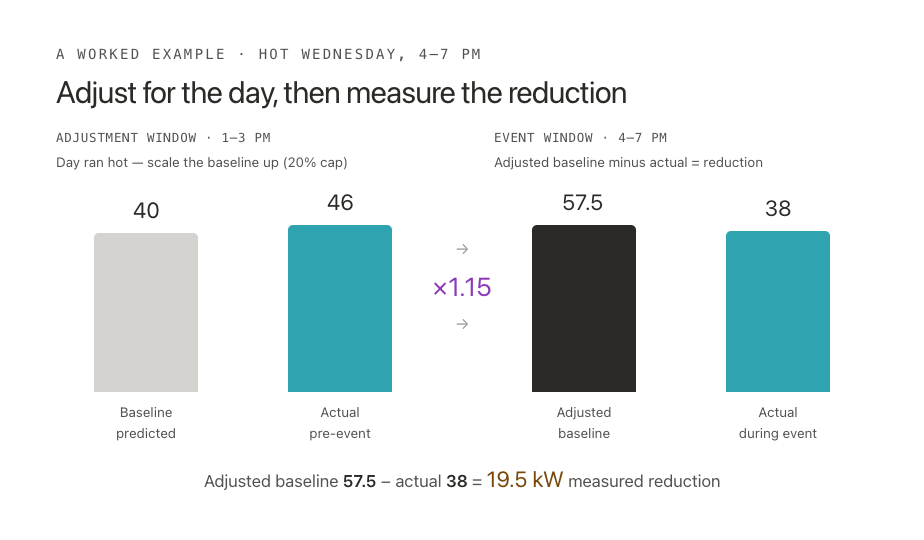
The fix is a day-of adjustment, a correction for how hot or cool the actual day turned out to be. It works by looking at the member's load in the hour or two before the event and comparing it to what the baseline predicted for those same hours. If the actual load is running above the prediction, the day is hotter than the baseline days, so the whole baseline scales up by the same proportion to match. If it is running below, the baseline scales down. Two rules keep this honest. A short gap is left before the event starts, so the member cannot pad the adjustment by spiking load right beforehand, and the adjustment is capped, often near 20 percent, so one odd hour cannot distort the number.
Because the adjustment is a stand-in for weather, it has limits. It reads low on a day still climbing toward a late peak, since the pre-event hours have not caught up yet, and it misses loads that lag temperature, like a building's thermal mass. When temperature drives most of the load, some programs regress load against degree hours instead, which is more accurate but harder to dispute.
A worked example
An event runs on a hot Wednesday from 4 to 7 PM. The five highest of the last ten eligible weekdays average 50 kW across that window, the raw baseline. In the 1 to 3 PM window beforehand, those same days averaged 40 kW, but the member pulled 46 kW on the event day. The ratio, 46 over 40, is 1.15, inside the cap, so the adjusted baseline is 57.5 kW. The member used 38 kW during the event, so the measured reduction is 19.5 kW. Without the adjustment it would have read 12 kW, underpaying by more than seven kilowatts. Across a fleet on a hot day, that gap adds up.
The baseline is only as good as the meter data
Every method here rests on an assumption that rarely gets stated: clean interval data for every participant. High X of Y, the day-of adjustment, and any fleet total all run on reliable hourly history. If the data has gaps, bad reads, or long intervals, the baseline inherits every one of them. Before debating high 5 of 10 versus high 4 of 5, it is worth knowing how good the underlying meter data actually is.
The short version
A load baseline is the best estimate of the load that would have happened without an event. The common build is high X of Y from recent comparable days, corrected with a capped day-of adjustment for weather. It applies only to programs that infer reduction from a meter, not to switched loads measured by connected load. It's incredibly important to get right as the incentives being paid to customers rests on that.
