The average home draws between 1-5Kw for regular activities. Planning for this range can be straightforward. Larger spikes are shorter and more coincidental – maybe an oven AND an HVAC compressor hit at the same time, etc. Add a level 2 EV to the mix, however, and that adds 7-11Kw to the home load – often for hours.
If the EV owner's neighbor also decides to buy an EV? That could add double that load to their shared transformer, creating a long-term overload situation that reduces the lifespan of your equipment.
Do you know if this is already happening on your network?
Utilities often know about EVs through incentive programs, managed charging enrollment, etc, but it can be difficult and/or expensive to determine an exact count of EVs on a network, and where they might be stressing your grid topology.
A member can buy an EV, install a charger, and plug-in without notification, interconnect agreement, or official record. The result: additional stress on grid infrastructure, unplanned load increases, or customers calling to figure out why their energy bill spiked 2x this month. (They didn't understand the impact of their 5PM post-work charging habit, and you didn't know to reach out.)
The gap between what utilities think is on their grid vs. what is actually there creates problems:
- Engineering teams working on infrastructure plans are working with an incomplete picture.
- Program teams sizing targets don't know what peak-shaving is possible or which loads could be shifted.
- Operations teams must cope with rapidly changing load shapes and spiky demand.
While building Texture's DER detection capabilities, it's clear to me that utilities already have the raw materials in their AMI system. Unlocking that data and turning it into actionable information about your grid is the missing piece. Texture can help, using a combination of physics, machine learning, and your meter data.
How DER detection works
Texture's detection model runs against interval meter data - anywhere between 5 and 60 minutes. Using a rolling window of about six to eight weeks, we search for patterns in the load curve that match known DER signatures.
The first step is physics: find me all the load spikes that match potential EV charging ramps. This looks like a sharp increase in load – typically 3.7 to 11 kilowatts depending on the charger level – sustained over several hours. This broad brush gives us our pool of potential candidates. We have reduced our haystack to a big bucket of legos. Now we need to find the elusive Technic 1x4 bricks we need to complete our masterpiece.
Now that we have our candidate pool, we want to minimize our false positives (so the model doesn't flag any multi-hour load above 3.5 and call it an EV). To do this, we bring in our machine learning model. The model has been trained to spot stand-out matches: meters that have shown a repeat charging session pattern across the detection window, sessions that show up overnight, etc. The model applies location-based weather correction to filter out heating and cooling loads that might look similar, and accounts for other DERs that could be present at the same meter.
The output of each detection run is a confidence-ranked list of EV candidate meters. Each meter is assigned a probability score to show how likely it is that there's an EV charging pattern match. Depending on how you want to use these results (perhaps you want to send outreach letters to members) you can choose where to draw the cut-off line. Perhaps you'd prefer 95% confidence and above for the first round of messages, then go down to 90, etc.
What is required to detect EVs?
Texture customers have the ability to connect their meter data directly to the platform. Once a connection is established with your meter data provider, meter data is automatically ingested, giving you a view of each meter, transformer, source, or grid element in a powerful Explore interface.
With 6-8 weeks of meter data in our system, you can run our EV analysis model with a button click. Each run will generate candidates based on what your meters are seeing on the grid, using our models and experience. Run once a month, once a week, once a day - whatever works best for you.
Taking action with EV detection
Getting a ranked list of meters with likely EVs is useful, but to really get value out of this information we want to take action. Texture gives you the tools to review candidates, inspect load curves, label your meters, and track customer outreach.
Review candidates with the data that triggered the flags
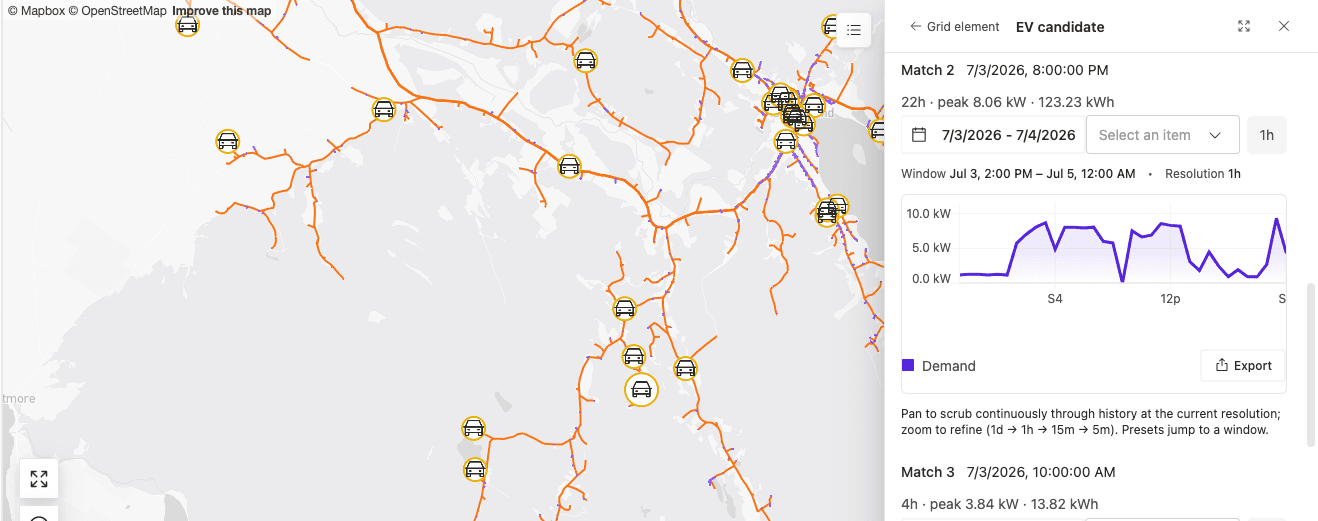
Every detection comes with the load curve evidence, ranked by probability. Click into a candidate to see the specific charging sessions the model identified – start time, peak draw, total consumption – overlaid against the rest of the home's load. Visual context is the difference between a spreadsheet of meter IDs and something on which a team member can take action.

Verify, dismiss, or follow up
Detections are candidates, not certainties. The Texture verification workflow lets staff confirm an EV, dismiss as non-EV, or log that the member has been contacted.
Every confirmation or dismissal feeds back into the model as labeled training data, so detection quality improves over time with use. It's a learning loop, and the more your team verifies, the sharper future detection becomes.

Review detected DER sites geographically
When site location data is available, either with service addresses or GPS coordinates, it unlocks questions like: "where are EVs clustering, and which transformers are they hitting?" or "What happens when I add 15 EVs to this source?"

This is where DER detection directly links to equipment overload prevention. EV clusters at specific transformers are what drive infrastructure stress, and knowing where adoption is concentrated is even more valuable than just knowing the system-wide total.
From one-time-detection to ongoing detection: the Texture Platform
Many utilities / many of you have received a one-off DER detection analysis at some point - perhaps you received a static spreadsheet or PDF with a point-in-time list of known DERs. But if you haven't gotten an update to that document since 2024, it may not be delivering the value you NEED to perform the best for your members. Texture is not building a one-time detection report. We are focused on building a platform that you can rely on to make key decisions about your grid with the most accurate, up-to-date information possible.
Because detection lives on the same platform as enrollment and programs, there's a direct path from "we found a likely EV" to "invite this member into managed charging." Detected devices can surface as prospective leads for demand response programs, BYOD battery enrollment, TOU rate education, or whatever program fits best.
Our detection loop – detect, verify, enroll, manage – is what turns meter data analysis into an operational capability rather than a one-time project.
Getting started with DER detection on Texture
DER detection runs on data most utilities already have: interval meter data from your AMI system. If your utility wants to understand what's actually on your grid, and turn that understanding into action - enrollment targets, planning inputs, and operational awareness - reach out to our team.
