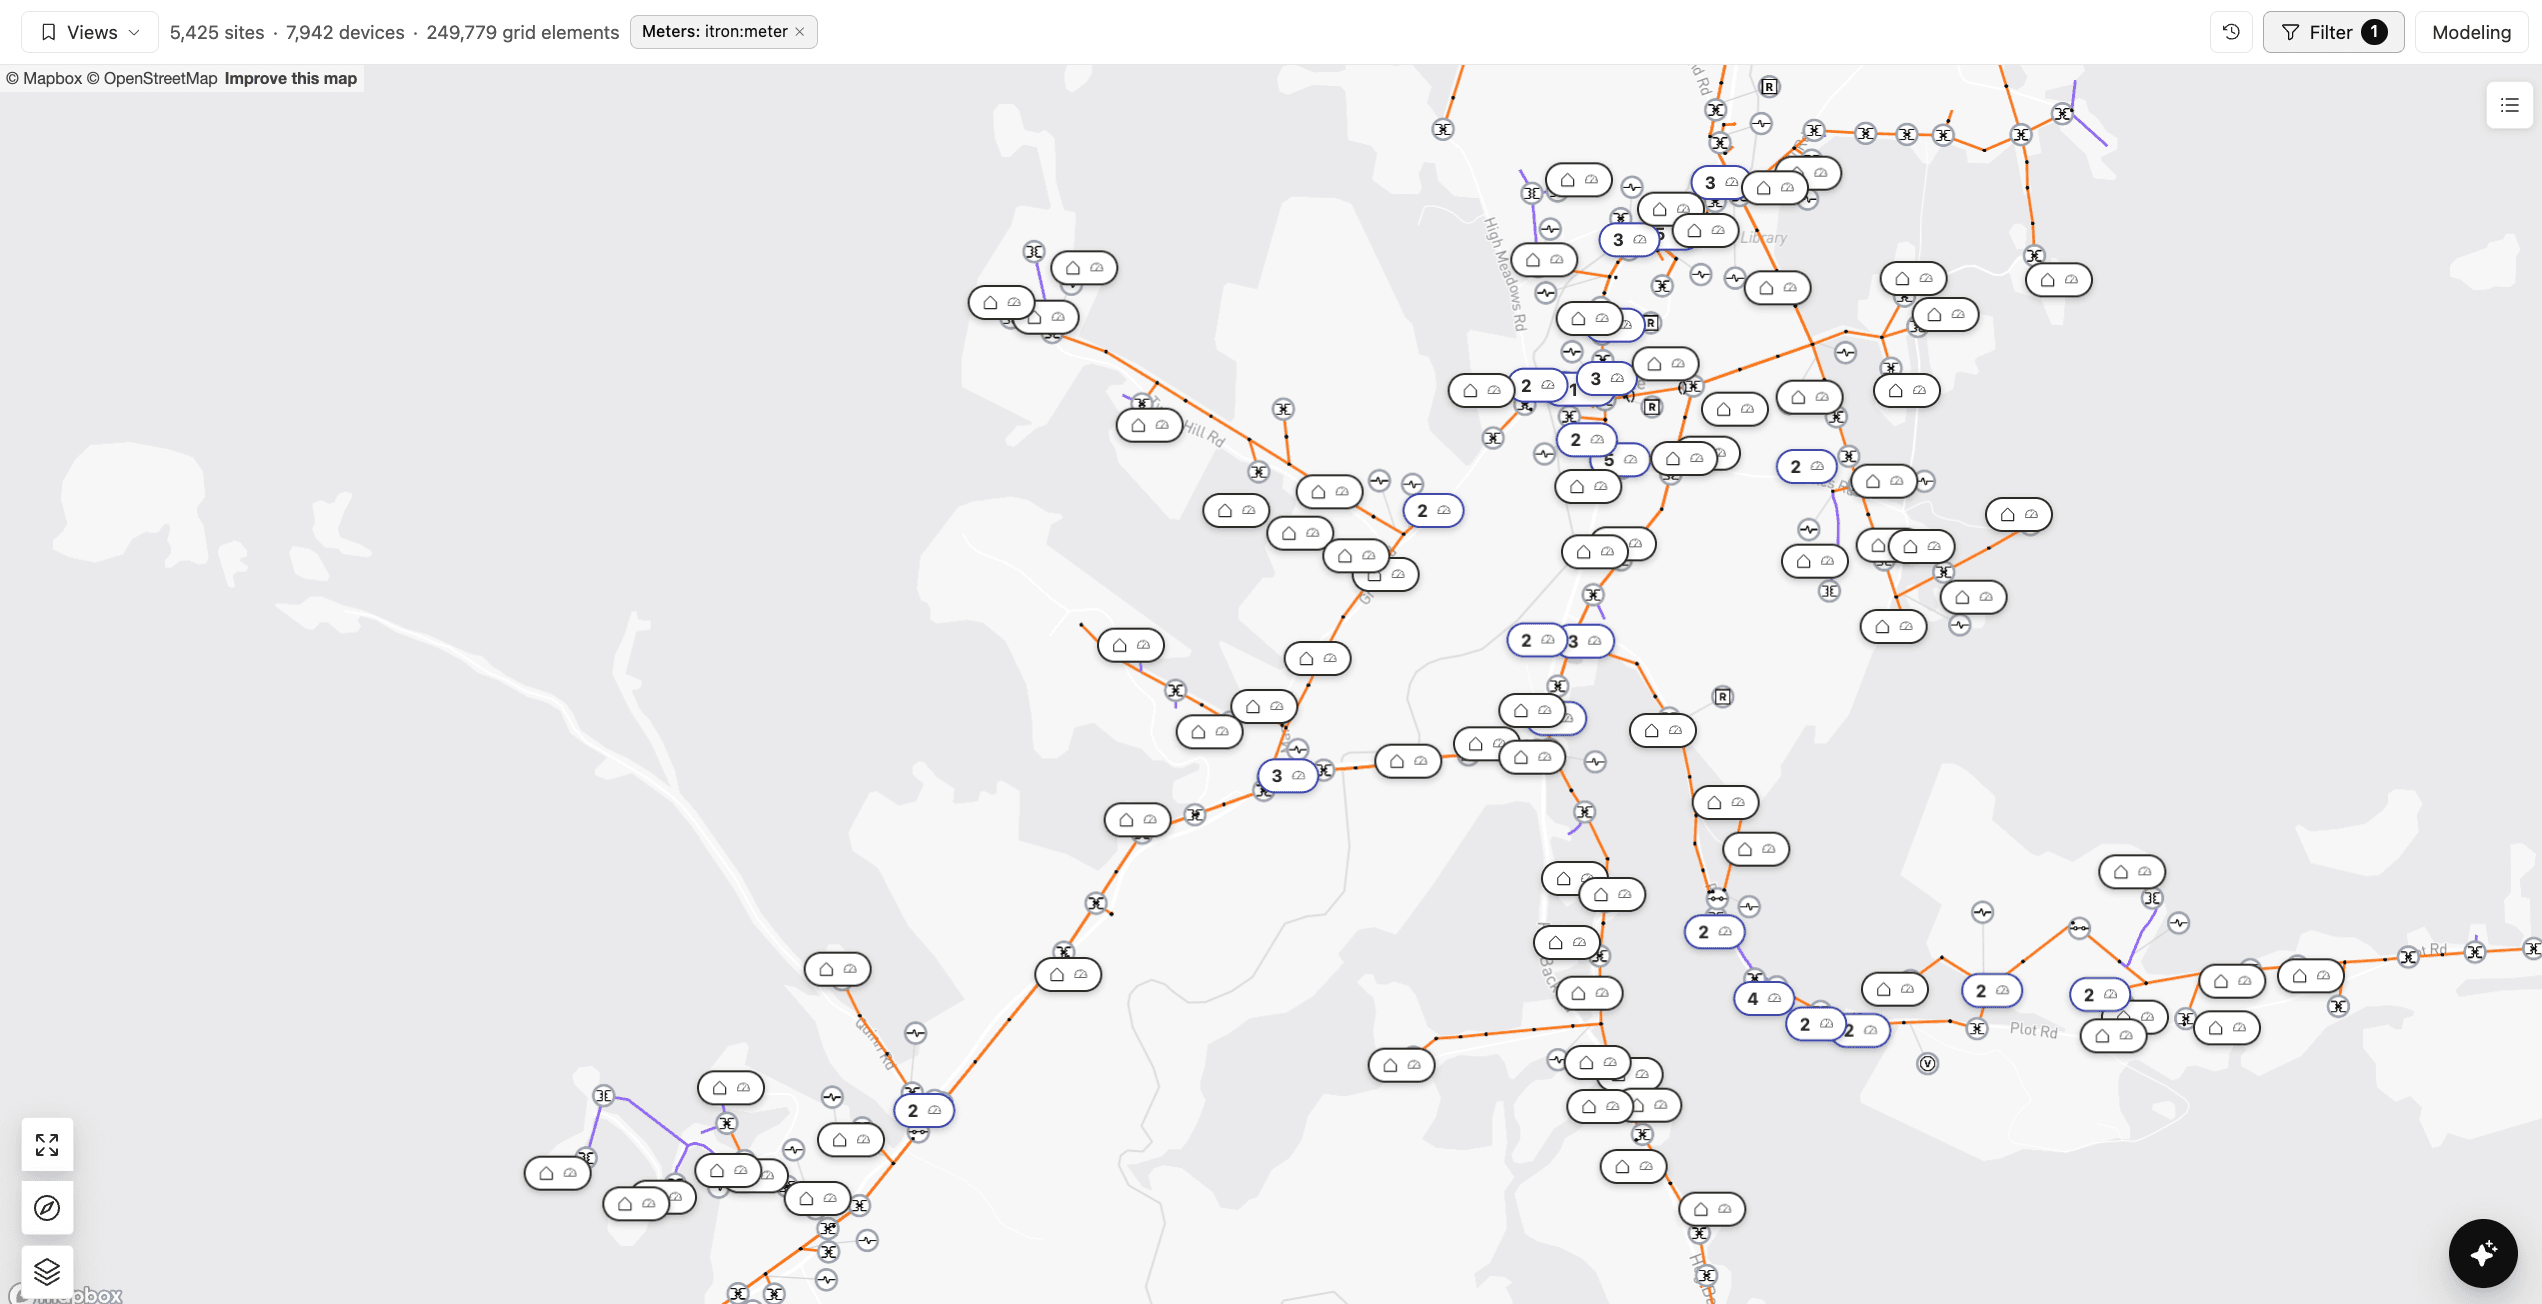
It's been a minute since I've had a chance to write about any of the new features and concepts we've developed at Texture. Today's focus is on breaking down another data source that we all know and want access to: the meter.
Texture surfaces data from utility meters at homes and businesses to give utilities insight into what consumption (and possibly generation) is happening there. Meters are already out there, already critical infrastructure, and already collecting data. Texture can help you unpack that data in service of actionable insights.
Since I didn't actually build the feature, I've pulled in Stefan to co-author this post and keep me honest on the details. We'll break down how to get your meter data into Texture, how to view the telemetry associated with that meter, how your meter maps to your other grid elements, and what you'd want to monitor to make sure the lights stay on and members stay happy. Let's go!
How to connect your meters to Texture
Before Texture can show you anything interesting about your meter data, you'll need to connect those meters to Texture's platform. We'll dive into the nitty-gritty in this section, but know that you don't have to be an expert in the details. Texture's Solutions team partners directly with your organization to build a data intake plan based on the structure below but tailored to your specific sources, systems, and requirements.
The high-level overview
Texture treats meters as a type of "device," just like batteries, EVs, and thermostats. If your utility uses Advanced Metering Infrastructure (AMI) hardware, you can connect your meters to Texture to see the data from those meters.
Your contact on Texture's Solutions team can help establish the initial connection with each meter manufacturer you're using. Once that initial setup is complete, your meters will be identified in the Texture platform by their meter numbers. That also helps tie meter data to that meter's physical location on the grid, enabling more targeted data analysis down the line. Data updates automatically, and new meters from the same manufacturer are also automatically onboarded.
The main categories of data that Texture will pull from your meter metrics are energy consumption, power quality, and daily demand. Consumption and voltage information are usually the most interesting areas for utilities monitoring AMI meter data. For capable meters, we'll also surface hardware temperature, voltage, and per-leg current data.
The technical details
When your meter is onboarded and associated with its meter number, that number becomes a join key to link the meter to its GIS metadata. That's how Texture can connect telemetry from your meter to a real, physical location on the grid. Meters will automatically attach to your grid hierarchy once their meter number matches a GIS service point.
If a meter covers both consumption and generation (like in a residential solar installation that feeds power back to the grid), that meter would carry both a consumer and generator GIS service point. That means you might see what looks like two meters at one address.
Note that if a meter is onboarded before that topology match exists, it'll "float" without a hierarchy position until the next topology refresh picks it up. There's no cause for concern here; consumption and voltage history predating the connection will be backfilled via your meter manufacturer's integration, so you'll see consumption and voltage history once the meter fully connects.
Texture brings in meter data from two different sources, to accommodate different AMI setups:
- MDM/AMI head-end — Texture polls an API on a set schedule, to deliver variable interval data for your full meter fleet. This source usually has about a day of latency.
- Real-time interval feed — Texture ingests a file drop delivered every few minutes via SFTP. This gives you near-instantaneous power and voltage readings.
Meter telemetry is stored as a time series, with one series per metric-and-channel combination, and with resolutions from five minutes up to one day. Texture collects data about energy (consumption, reactive and apparent energy), power quality (voltage and current total harmonic distortion, imbalance, frequency, power factor), and daily demand (real and reactive). For capable meters, we also gather information about voltage and asset temperature, and high-resolution per-leg current data.
How to view meter telemetry in Texture
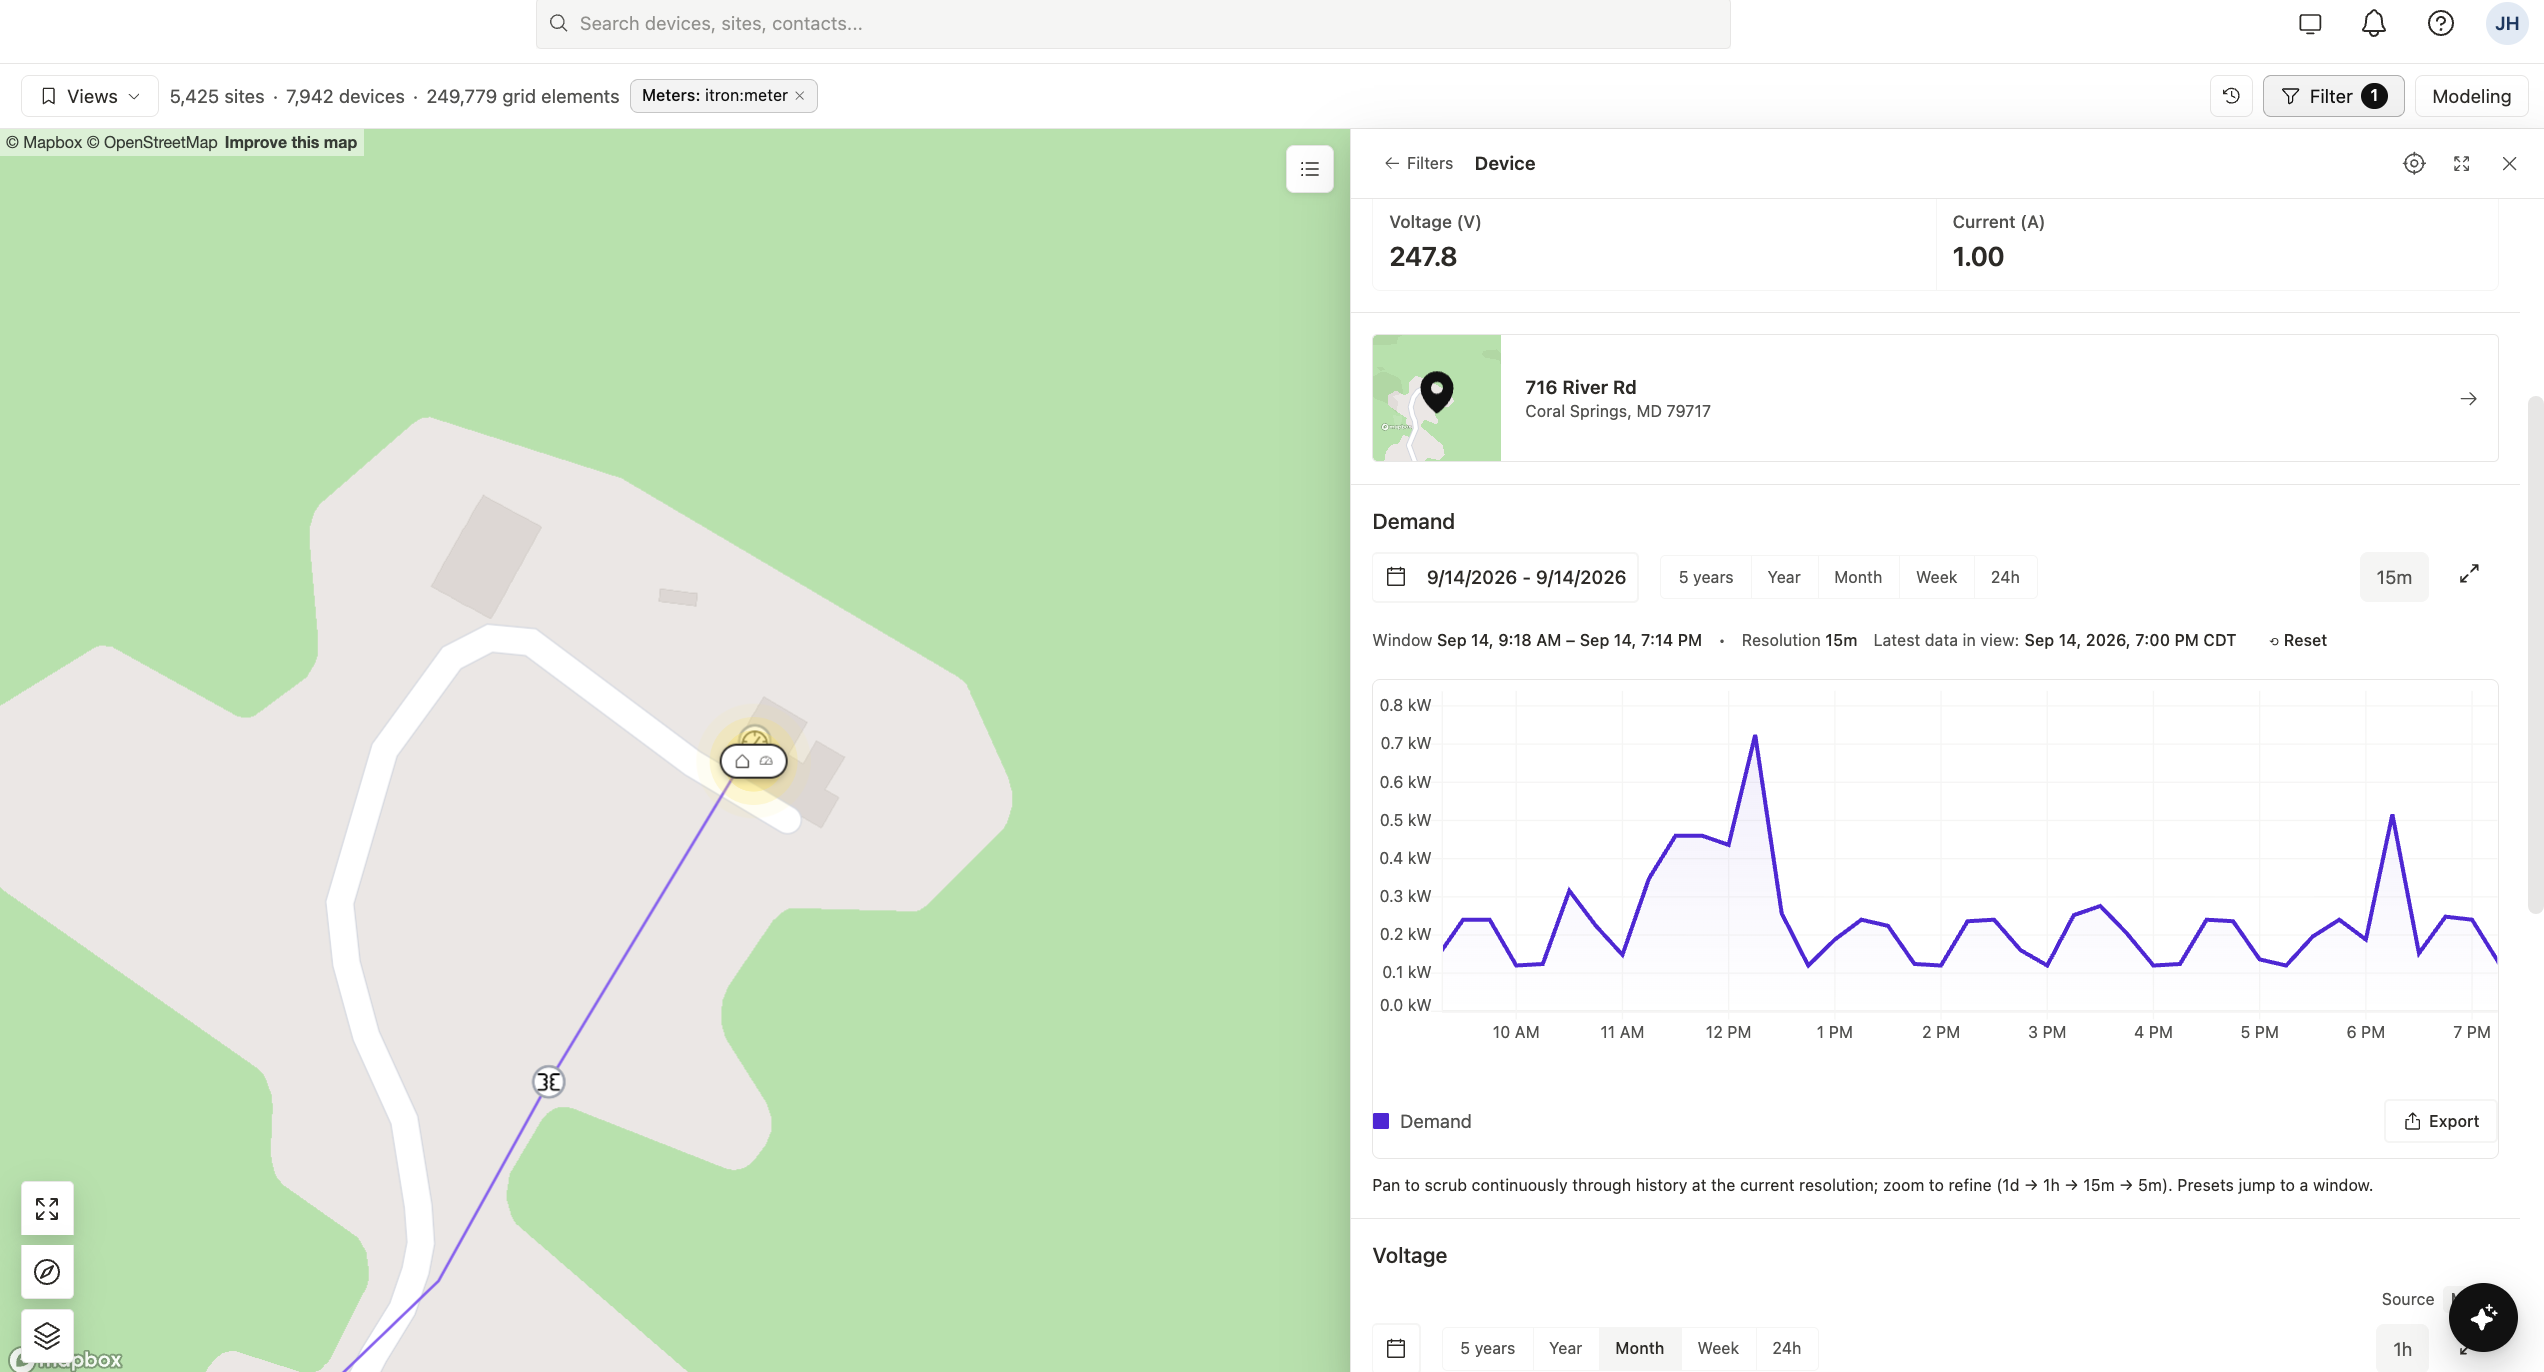
Once a meter's data is flowing into Texture, you can get eyes on it through Explore or Devices.
In Explore, filter by device type for "Meters," then select one off the map or the list to pull up its telemetry. If voltage is available for that particular meter, the displayed telemetry will include the meter's voltage chart.
From Devices, you can search by meter number or filter by device type and click straight into a specific meter's detail page. You'll reach the same underlying view either way.
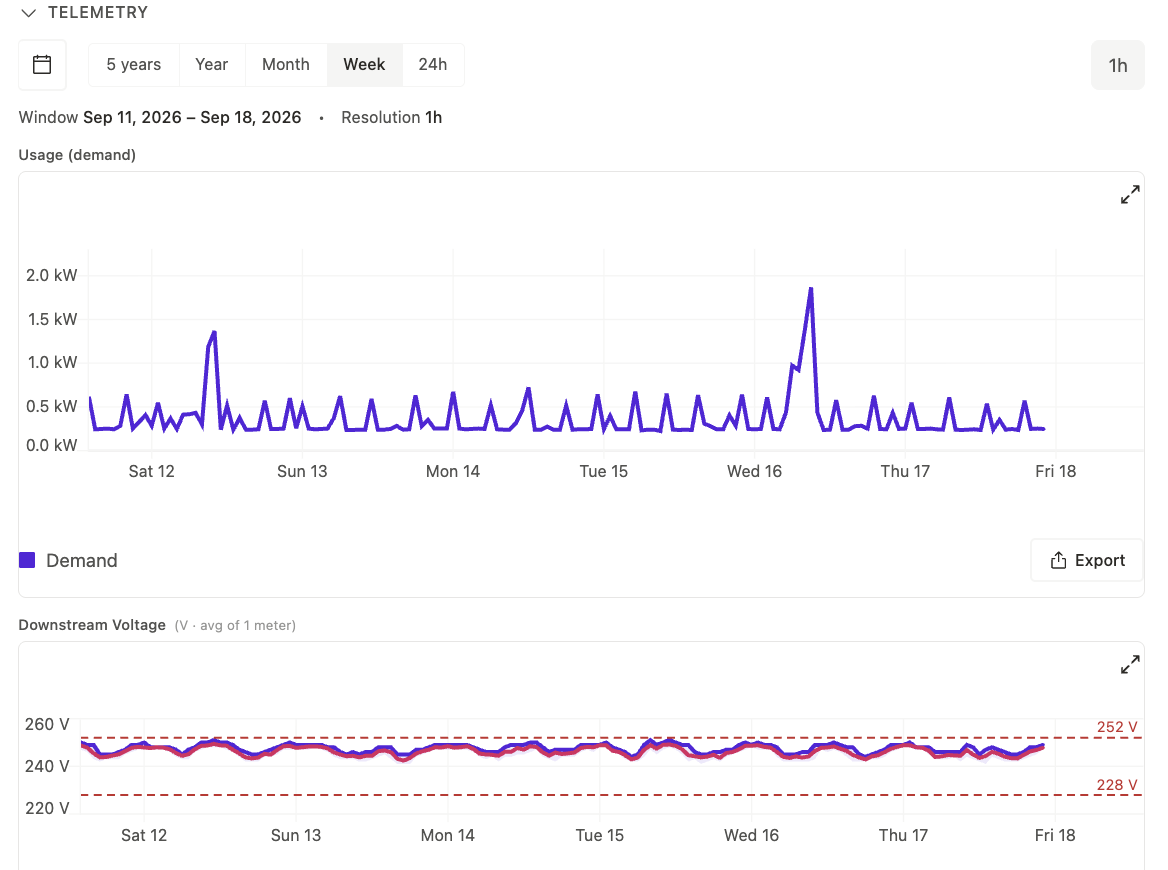
Where it's available, the voltage chart is one of the more immediately useful things on the meter telemetry page. It plots voltage over time at five-minute resolution where possible, with ANSI service limit lines drawn in — roughly 252V high and 228V low for standard 240V service. That makes over- and under-voltage conditions easy to spot at a glance, instead of having to dig through raw readings.
Texture can proactively monitor your meters for failure conditions
Connecting your meter data to Texture makes it easier to see information at a glance, but it also unlocks automated, proactive monitoring. Monitors watch your data nonstop, waiting for a condition to be met. If they see a meter that matches the condition, they'll send a notification, so you don't have to be staring at a dashboard all day to know the moment something looks off.
For meters, the conditions worth watching usually fall into a few buckets:
- Voltage or current out of range — Flagging meters with voltage or current deviations outside a normal window allows you to catch under- or over-voltage conditions before a member calls in about it.
- Stale data (new data isn't loading) — Alerting when a meter stops reporting can help you get a head-start on outage triage, as an uncommunicative meter is often your earliest signal of a broader system failure.
- Power output or temperature above set thresholds — For meters capable of reporting high-resolution data, spikes in power output or temperature are another potential source of information about hardware that might need repair or replacement.
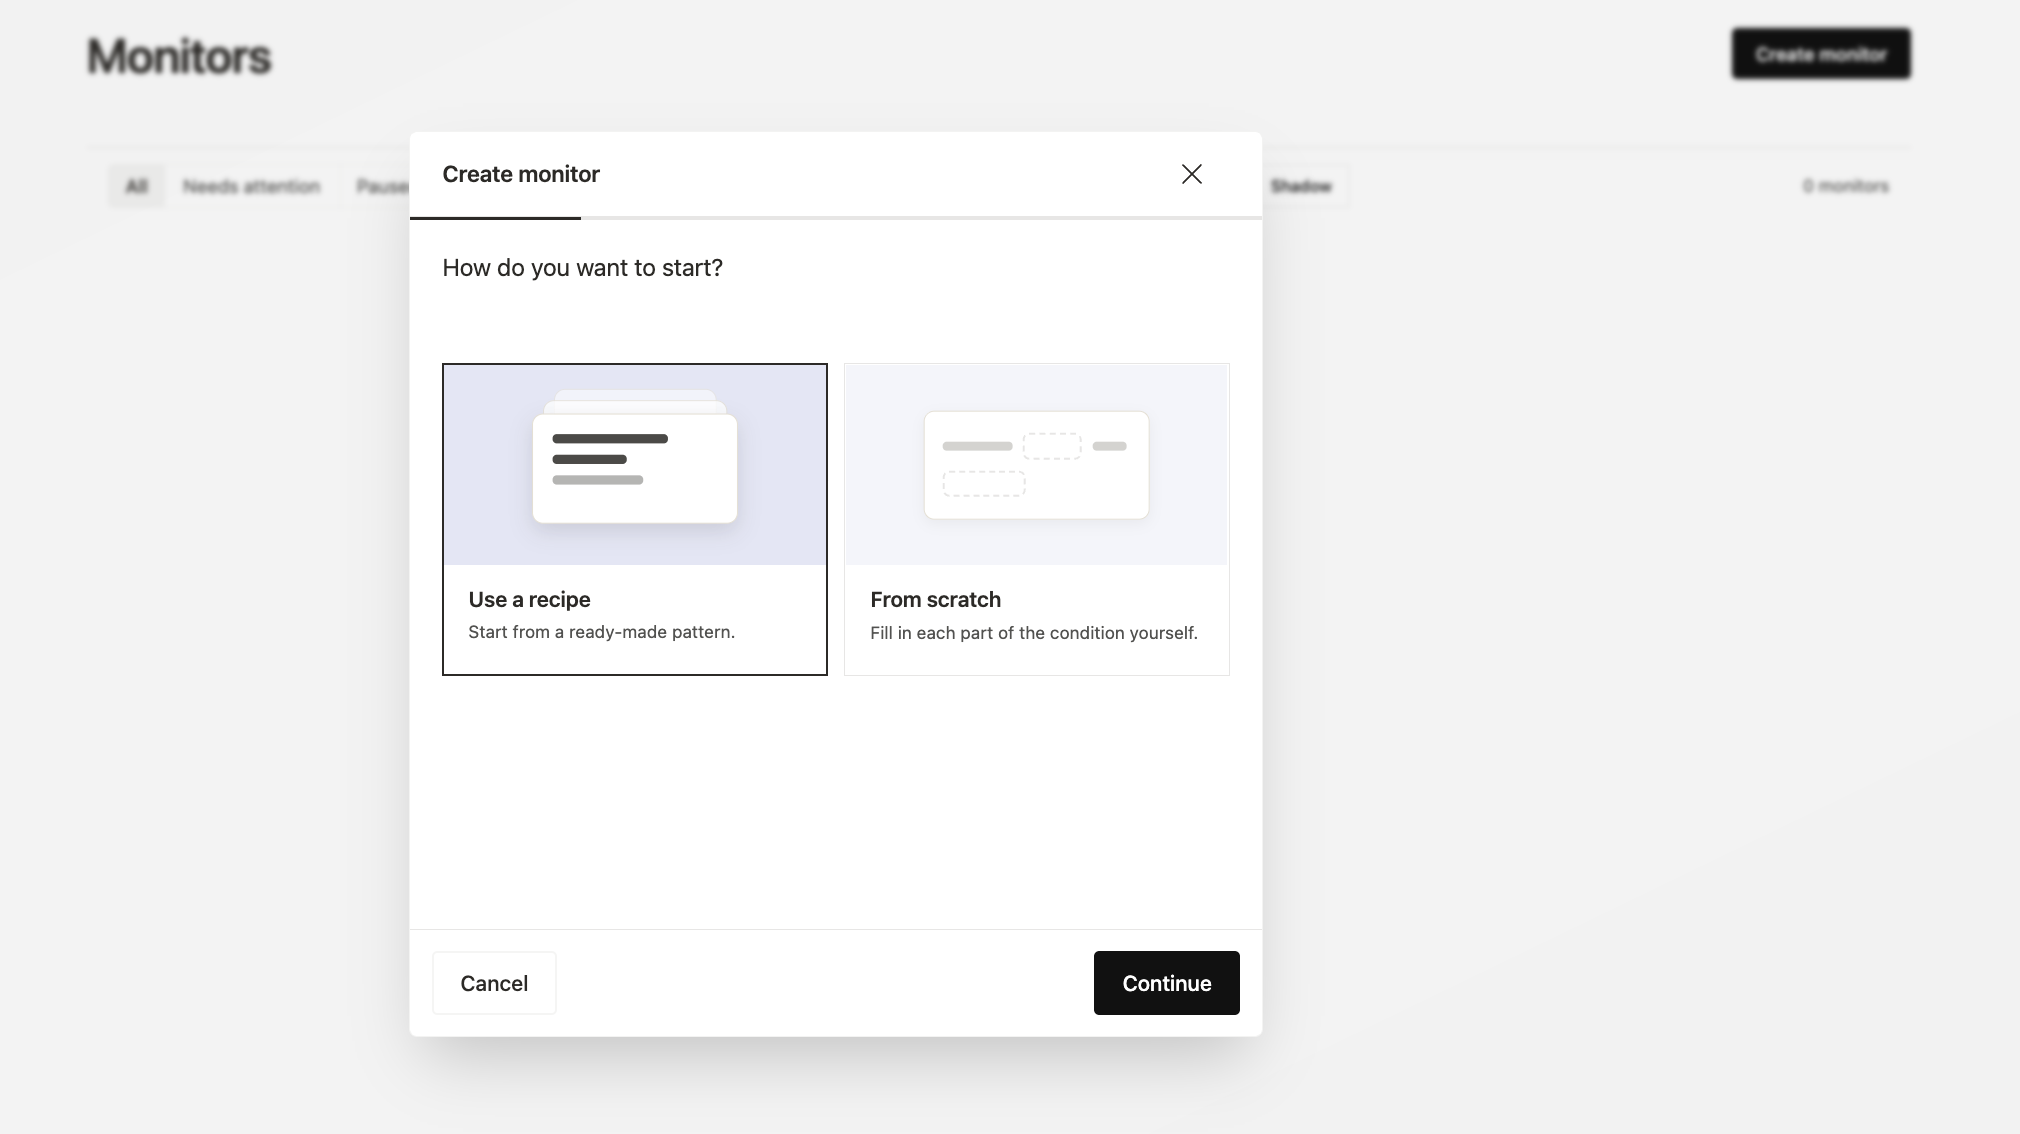
Setting up a meter monitor is simple. First, navigate to Monitors. You can choose a template or build your own custom monitor. If you choose to build your own, you can define the monitor type (threshold, change, data freshness, or status) and scope (workspace, device type, site, collection, or program). Then you'll pick the metric/condition and set your check frequency, anywhere from several minutes to once an hour. Lastly, you'll configure your notification preferences, so Texture can notify you when the condition is triggered.
How to explore your grid hierarchy
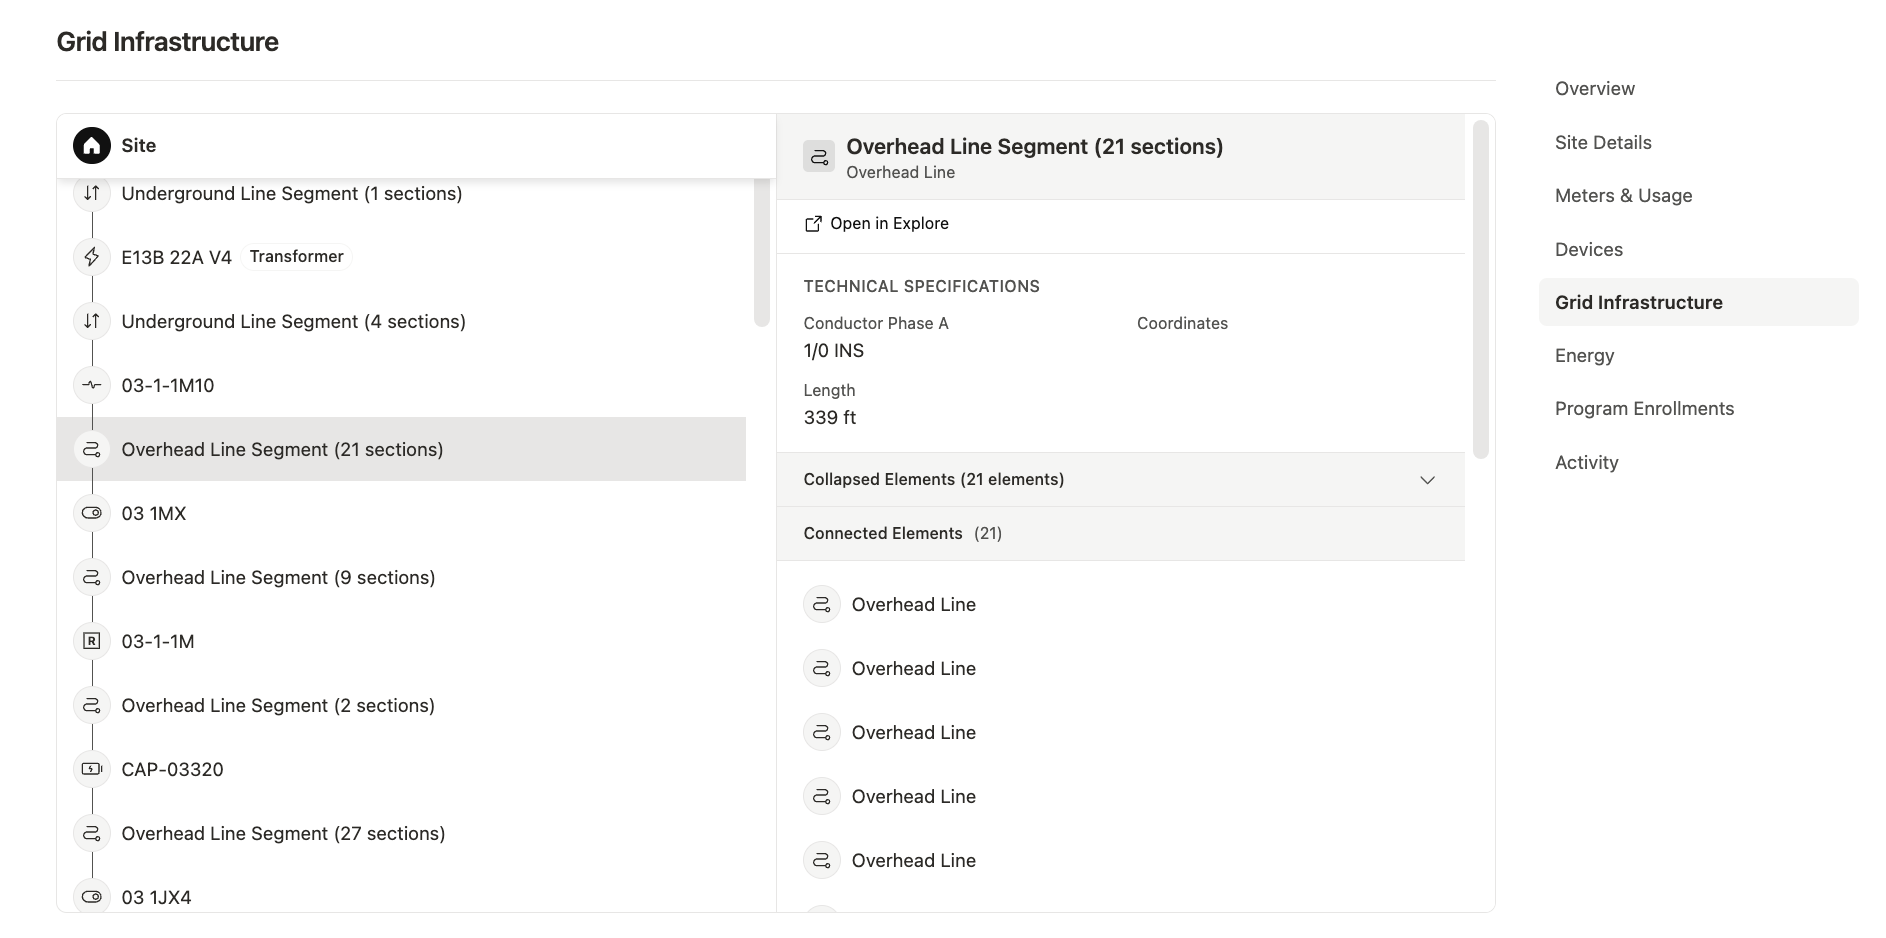
Meters don't live in isolation, and we can build off their connection to other grid elements to gain even more valuable insights.
Your grid is made up of a variety of elements, from meters to substations, feeders, transformers, lines, and poles. If you think of your grid topology as a tree, meters are the leaf nodes, the end of a chain but existing in a complex relationship with all of the other elements. Texture makes that relationship visible and understandable via the grid hierarchy.
From Explore, find any grid element (like an individual meter site, substation, or pole) by search, list, or map. Click on the element, then open "Grid hierarchy" from its details panel.
Once you're in the hierarchy, you can jump between connected elements to navigate around. The grid hierarchy allows you to trace that element all the way upstream to its substation source, or look downstream to see every meter that rolls up to it. And since all of that comes from your imported GIS and connectivity data, you'll also see metadata like conductor specs, transformer ratings, and any available telemetry.
Texture's grid hierarchy functionality allows you to use meter data to make effective decisions at the grid level. Let's talk about what specifically it can unlock.
What can this unlock for your org?
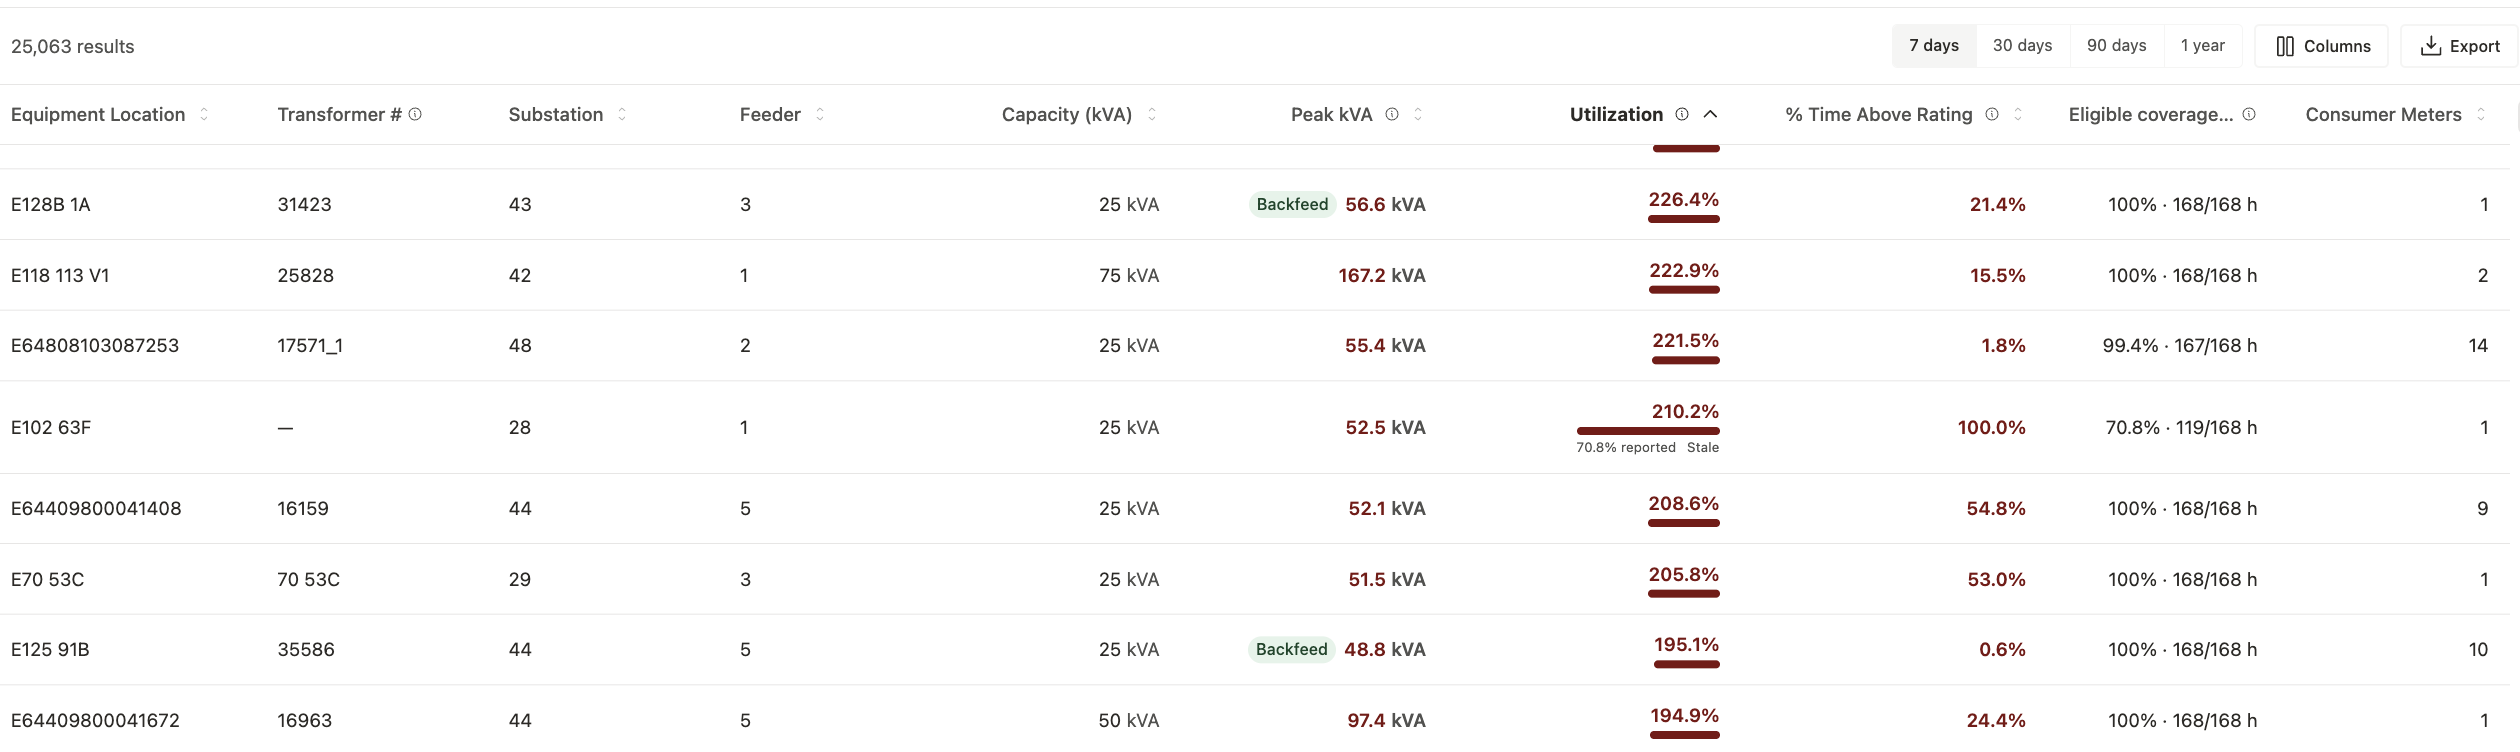
Accurate meter telemetry data paired with a holistic view of grid element interaction can enable you to make better transformer loading calculations. That's where meter data starts paying dividends beyond the meter itself.
Distribution transformers rarely report their own telemetry, so Texture estimates how hard a transformer is working by aggregating the meters downstream of it. Using grid topology, we match each meter to its upstream transformer, sum interval load across everything connected to it, and compare that total against the transformer's rated kVA capacity. Read more in our docs on how we configure these estimates.
You'll see that aggregated load plotted over time in Texture with the rated capacity drawn in as a dotted threshold line, so stress or underutilization jumps out visually. The catch — and it's an important one — is that rated capacity is a gating input, so ideally you'd have confirmed nameplate ratings coming through in your GIS data. Without those ratings, you can still track load trends, but you can't say definitively whether a transformer is over- or under-utilized.
That's the throughline of this whole post: Clean meter data, mapped correctly through your grid hierarchy, is what makes something like transformer loading possible in the first place. And the throughline of your Texture journey is our wonderful Solutions team. The same team that helps you plan data intake sticks around to help you get the most out of what that data can unlock, whether that's transformer loading, a custom monitor, or something specific to how your grid operates.
If you are a utility trying to figure out how to make your grid data interactive, and how to stop firefighting and be proactive, contact Texture for a full demo of our agentic grid operating system.

